 Price Rally After Breaking Resistance?")

The Polygon (MATIC) price finally reached a close above a long-term descending resistance trend line that had been in place since the all-time high.
Despite the breakout, MATIC failed to accelerate its rate of increase. Will it do so soon?
Polygon Closes Above Long-Term Resistance
The MATIC price had decreased below a long-term descending resistance trend line since December 2021, when it traded at an all-time high of $2.90. The decrease was swift, leading to a low of $0.32 in June.
MATIC began an upward movement afterward but failed to break out. Rather, the descending resistance trend line rejected the price in February 2023 (red icon).
After a higher low and two more unsuccessful breakout attempts, MATIC finally broke out last week, reaching a close above the resistance trend line. At the time, the trend line had been in place for nearly 730 days.
Traders in the market utilize the Relative Strength Index (RSI) as a momentum gauge to recognize situations of overbought or oversold conditions and determine whether to acquire or dispose of an asset.
When the readings surpass 50 and show an upward trend, the bulls maintain an advantage. Conversely, readings below 50 indicate a disadvantage for bulls. The weekly RSI is on the rise and positioned above 50, indicating a bullish trend.
Read More: What is Polygon (MATIC)?
What Do Analysts Think?
Cryptocurrency traders and analysts on X have a bullish outlook on the future MATIC price trend.
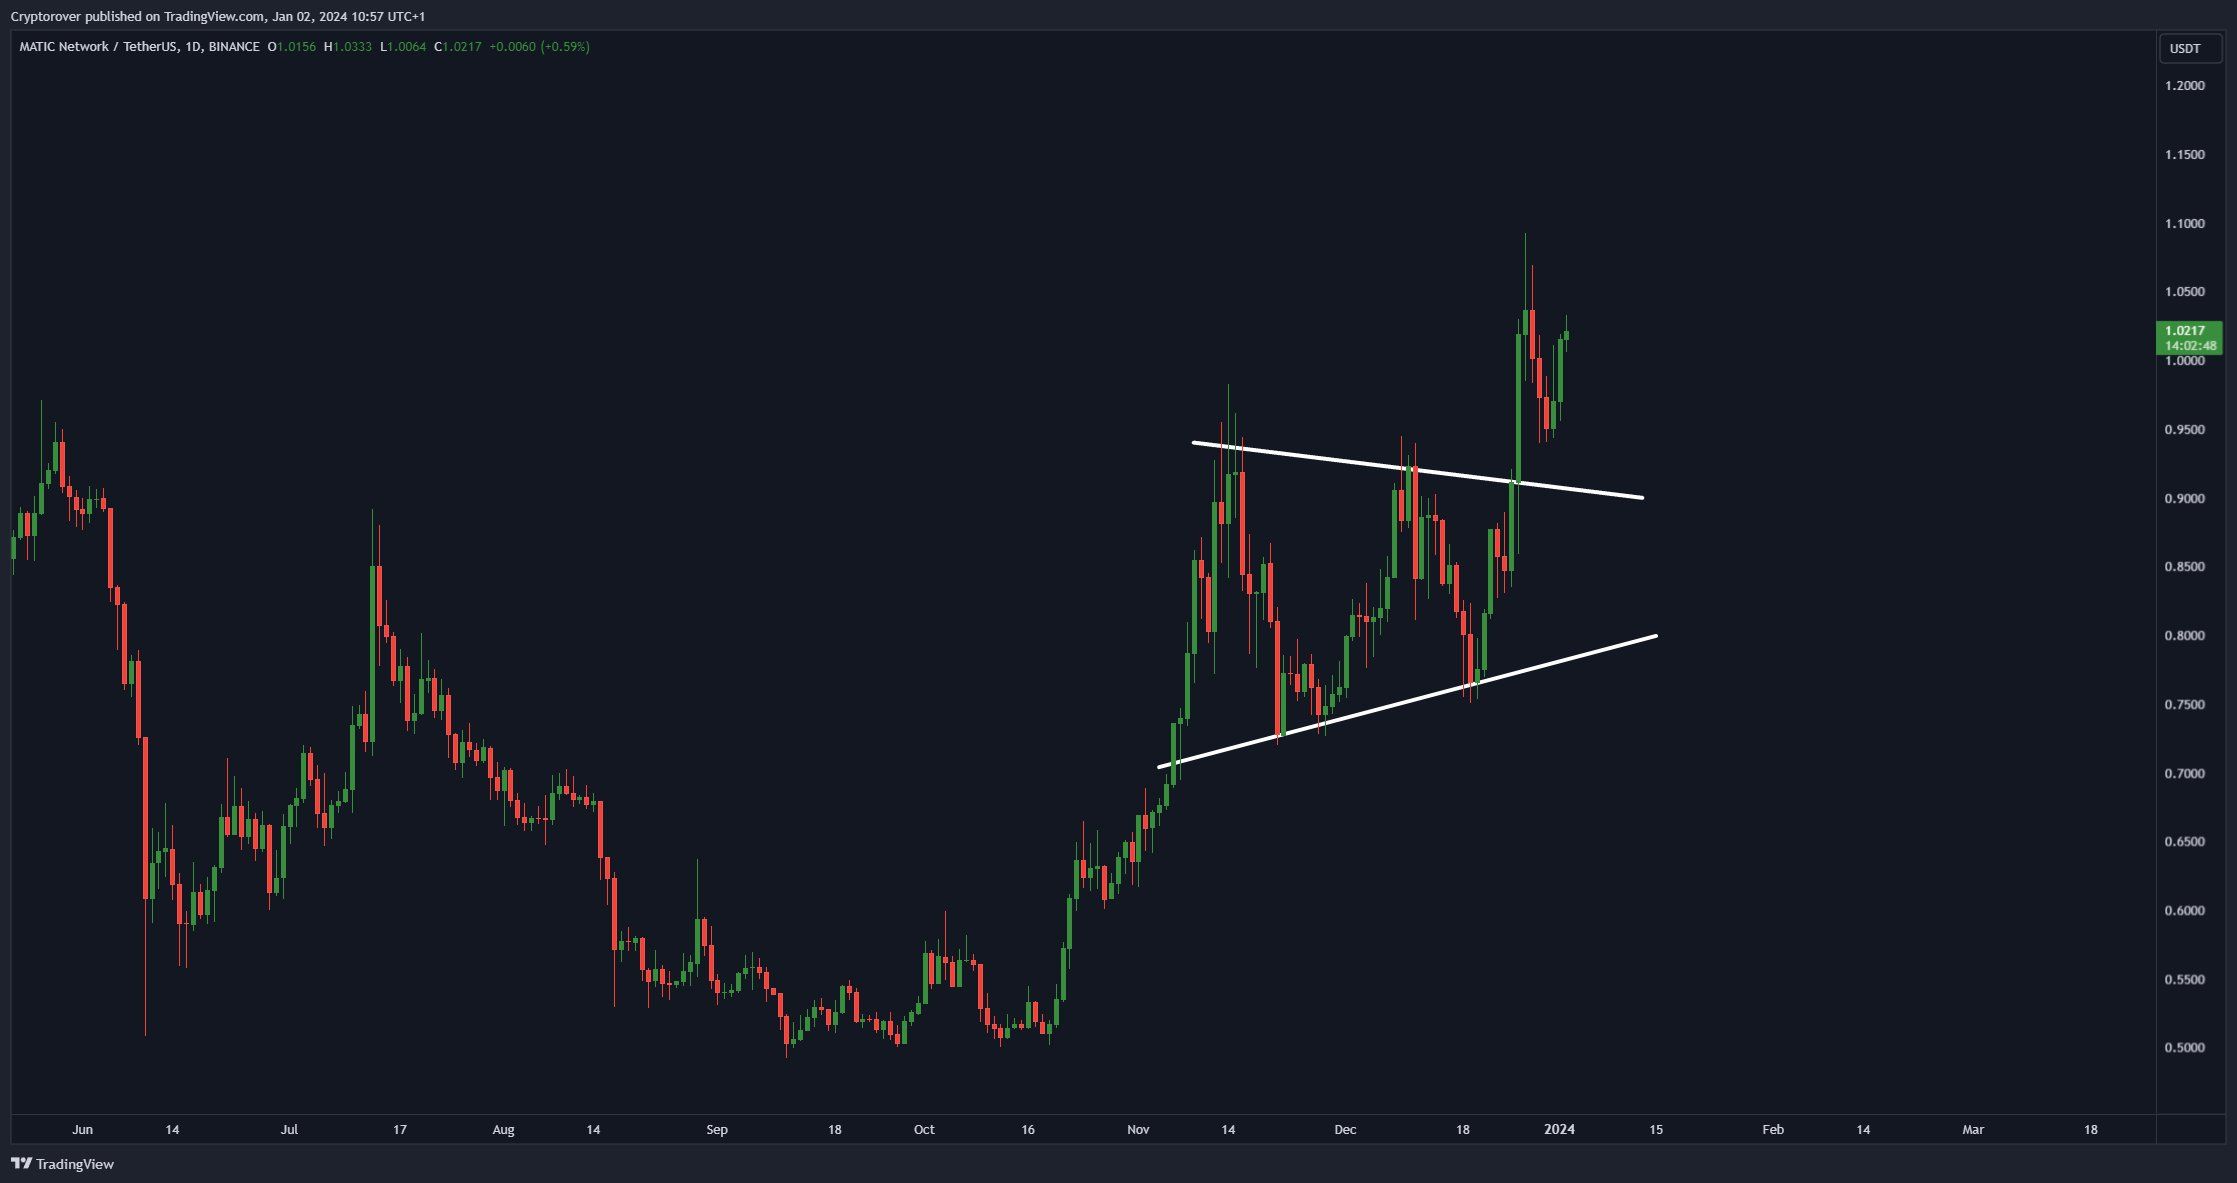
Crypto Rover believes the price will reach $1.15 because of a breakout from a symmetrical triangle pattern.
Rekt Capital suggests that the price is retesting its breakout level and will then resume its ascent. He tweeted:
Finally tags the blue resistance for a +44% rally Rejects there, now dipping into the top of the Ascending Triangle #MATIC broke out from On the cusp of a retest attempt Successful retest there may enable a revisit of the blue resistance above
Finally, Bull Lord noted the breakout from the long-term descending resistance trend line and suggested that it would catalyze an increase to a new all-time high price.
Read More: How to Buy Polygon (MATIC)?
MATIC Price Prediction: Will Price Move Above $1 Again?
The daily time frame suggests that the MATIC price trend is bullish. This is because of the price action and RSI readings.
The price movement shows that MATIC broke out from a symmetrical triangle and the $0.95 horizontal area. It was then validated as support (green icon). The daily RSI aligns with the bullish outlook since the indicator broke out from its bearish divergence trend line (green).
If the upward movement continues, MATIC can increase by 55% and reach the next resistance level at $1.55.
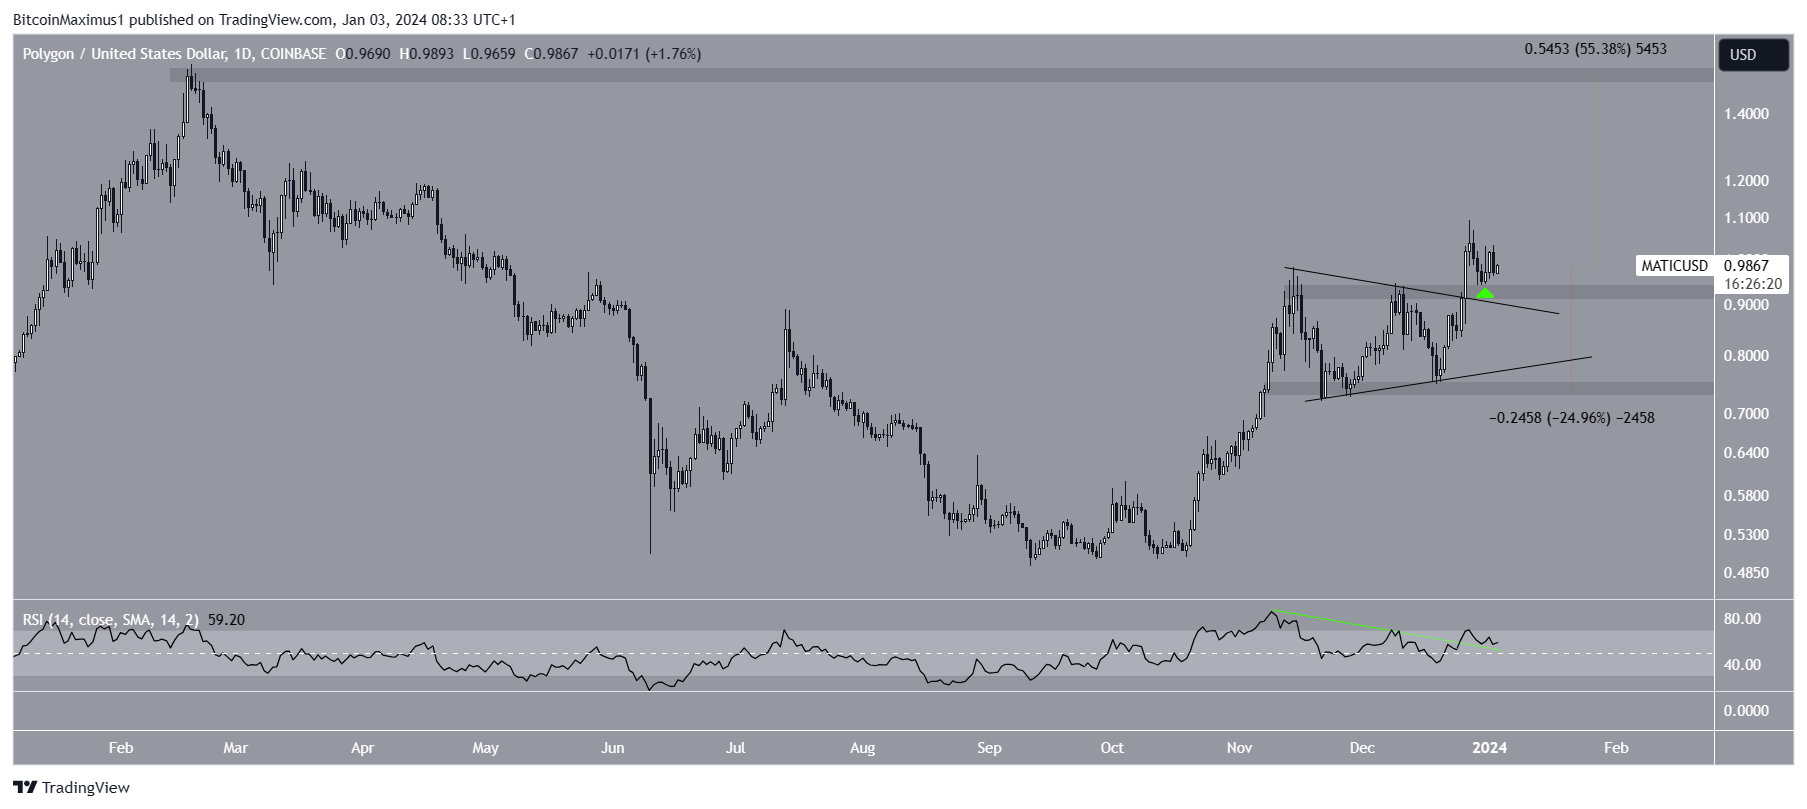
Despite this bullish MATIC price prediction, a close below $0.95 will invalidate the ongoing breakout. If this happens, it can cause a 25% drop to the closest support at $0.75.
For BeInCrypto’s latest crypto market analysis, click here.
Disclaimer
In line with the Trust Project guidelines, this price analysis article is for informational purposes only and should not be considered financial or investment advice. BeInCrypto is committed to accurate, unbiased reporting, but market conditions are subject to change without notice. Always conduct your own research and consult with a professional before making any financial decisions. Please note that our Terms and Conditions, Privacy Policy, and Disclaimers have been updated.


Be the first to comment