Most of the top cryptocurrencies are trading with low highs and higher lows as traders assess next steps
Bitcoin
Bitcoin has broken above $9,300 for the first time in a week as the bears failed an attempt to sustain prices below $9,000. With the return of buying power, Bitcoin broke resistance found at the 20-day EMA at $9,255.
The next target is to breach the 50-day simple moving average and the immediate resistance level at $9,392 — likely to be aggressively defended by the bears.
A push above the 50-day SMA could see bulls test prices near $10,000. However, if bears reject prices at $9,392, BTC/USD could sink to lows of $8,900. Below this level, bulls have support at $8,638.
Ethereum
Ethereum is trading above the 20-day EMA at $232, buoyed by strong support at accumulation levels between $220 and $230. The crypto asset is also priced above the 50-day MA, with bulls likely to push prices to recent highs at $249.

On the upside, the next target would be $253, which is likely to provide strong resistance and lead to an eventual drop to current levels. As for indicators, the RSI is trending positive and a short term rally is much more likely if the wider market sustains the momentum.
Bitcoin SV
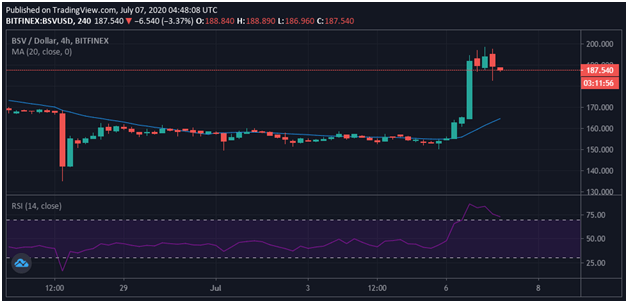
BSV/USD added $40 to its value via a large 26% spike that took it to an intraday high of $197.16.
Bitcoin SV has seen a major uptick in the last 24 hours, with bulls likely to eye a breakout above $200.
The surge to highs of $197 included BSV/USD breaching several resistance levels above intraday lows of $154. Although the price of this Bitcoin fork has tempered the gains in the Asian trading session, bulls still have the potential to push higher given prices to remain above major moving averages.

If bulls keep seller at bay and push prices above the psychological $200, the next major resistances are at $210 and $218. The latter represents a peak BSV/USD hit after bouncing from March lows of $104.
However, given the sudden nature of the uptick, sellers are likely to reject any further upside. In such a case, BSV/USD could drop back to the 20-day moving average at $168. The RSI that had shot into overbought conditions has begun to slop on the 4-hour charts.


Be the first to comment