
Ethereum (ETH) has bounced above the $1,860 horizontal support area and completed a leading diagonal in the process.
Litecoin (LTC) is following a descending resistance line and trading below the $146 horizontal resistance area.
Cardano (ADA) has been following a long-term ascending support line and has broken out from a short-term descending resistance line.
ETH
ETH has been increasing since June 22, when it reached a low of $1,700. It created a higher low on June 26 before resuming its upward movement.
Measuring from May 19, this was the fourth time that ETH made a low inside the $1,860 horizontal support area.
On July 7, ETH reached a high of $2,409 before decreasing. This potentially completed a leading diagonal pattern. Diagonals often have a sharp retracement, therefore another touch of the $1,860 support area is not out of the question. It would also coincide with the 0.786 Fib retracement support level.
Afterwards, ETH would be expected to move upwards. The closest resistance is at $2,880.
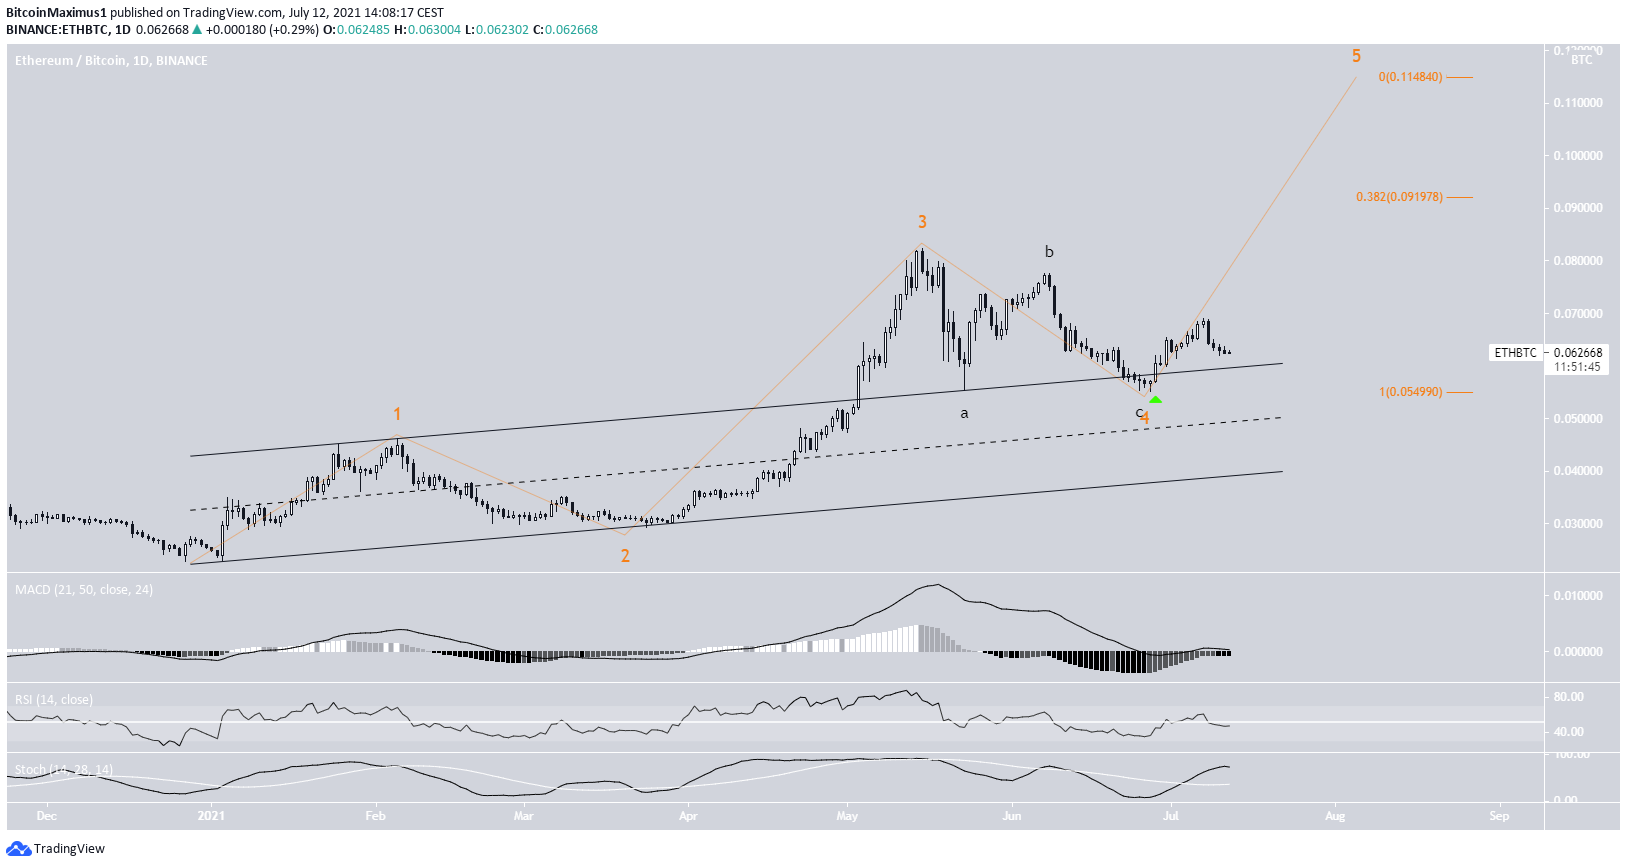
ETH/BTC has been increasing since June 27, when it reached a low of ₿0.055. It is possible that the low completed a fourth wave pullback.
So far, it has reached a high of ₿0.069, doing so on July 7.
Technical indicators are bullish, though they are showing decreasing strength. The MACD & RSI are at the 0 and 50 lines, respectively, values close to neutrality. The Stochastic oscillator has made a bullish cross and is moving upwards.
Potential targets for the top of the entire upward movement are at ₿0.091 and ₿0.114.
Highlights
ETH is trading above the $1,860 horizontal support area.
It has completed a leading diagonal.
LTC
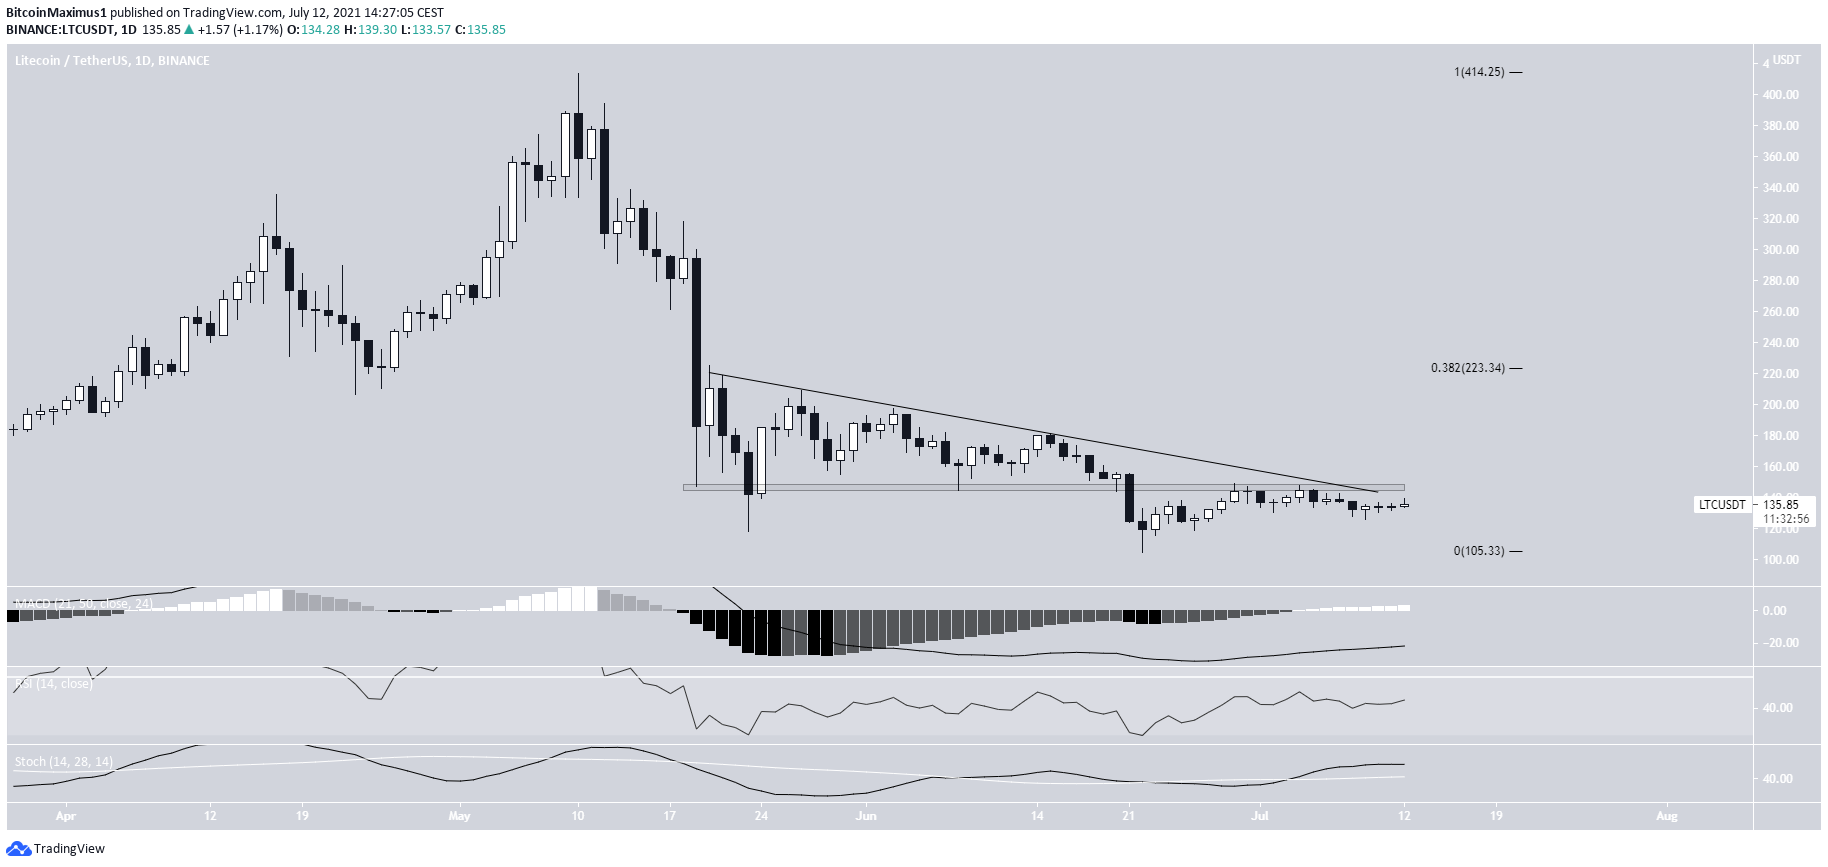
LTC has been decreasing since May 10, and following a descending resistance line since May 20. On June 22, it reached a low of $104.92 but reversed its trend and has been moving upwards since.
Currently, it is in the process of breaking out from the aforementioned descending resistance line and the $148 horizontal resistance area.
Technical indicators are bullish, supporting the possibility that LTC breaks out. If so, the next closest resistance would be at $223.
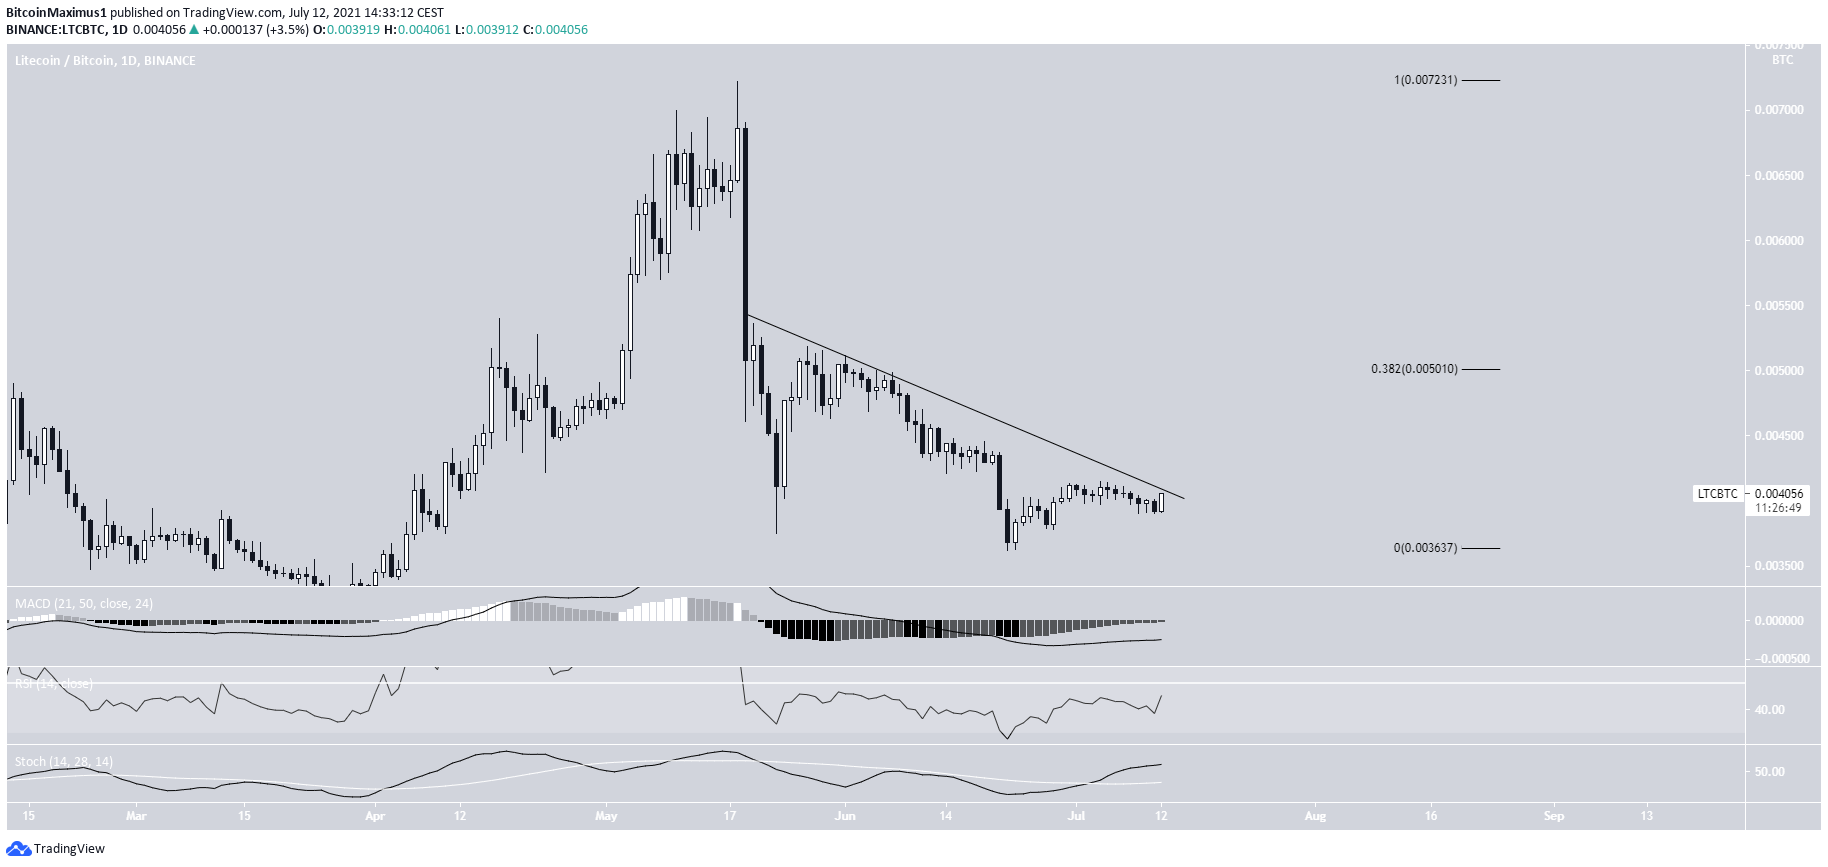
Similarly to the USD pair, LTC/BTC is also following a descending resistance line, and has been doing so since May 10.
It completed a double bottom pattern on June 22 and has been moving upwards since.
Technical indicators support the continuation of the upward movement and eventual breakout. If so, the next resistance area would be at ₿0.005.
Highlights
LTC is following a descending resistance line.
There is resistance at $148.
ADA
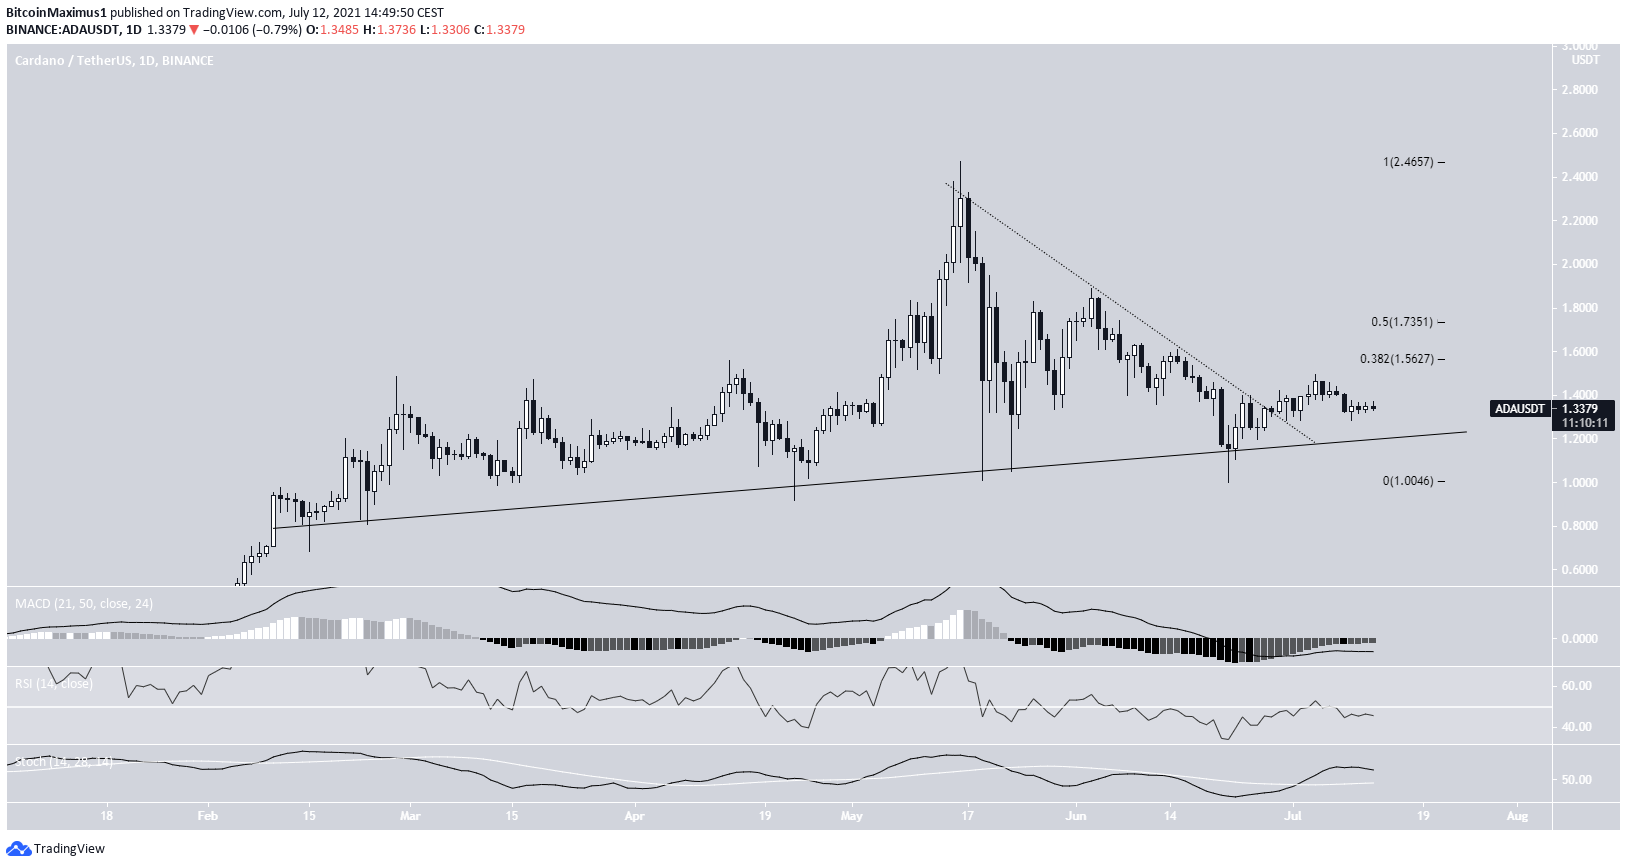
ADA has been following an ascending support line since the beginning of February. This led to an all-time high price of $2.47 being reached on May 14.
The token has been decreasing alongside a descending resistance line (dotted) since. On June 28, it broke out from this resistance lien and proceeded to reach a high of $1.49 on July 4.
Technical indicators are still neutral, but leaning on bullish. The Stochastic oscillator has made a bullish cross, but the MACD & RSI are below 0 and 50, respectively, even though both are moving upwards. Nevertheless, the trend can be considered bullish as long as ADA is trading above this support line.
The closest resistances are at $1.56 and $1.73, respectively. These are the 0.382 and 0.5 Fib retracement resistance levels.
The closest resistance would be at 4700 satoshis.
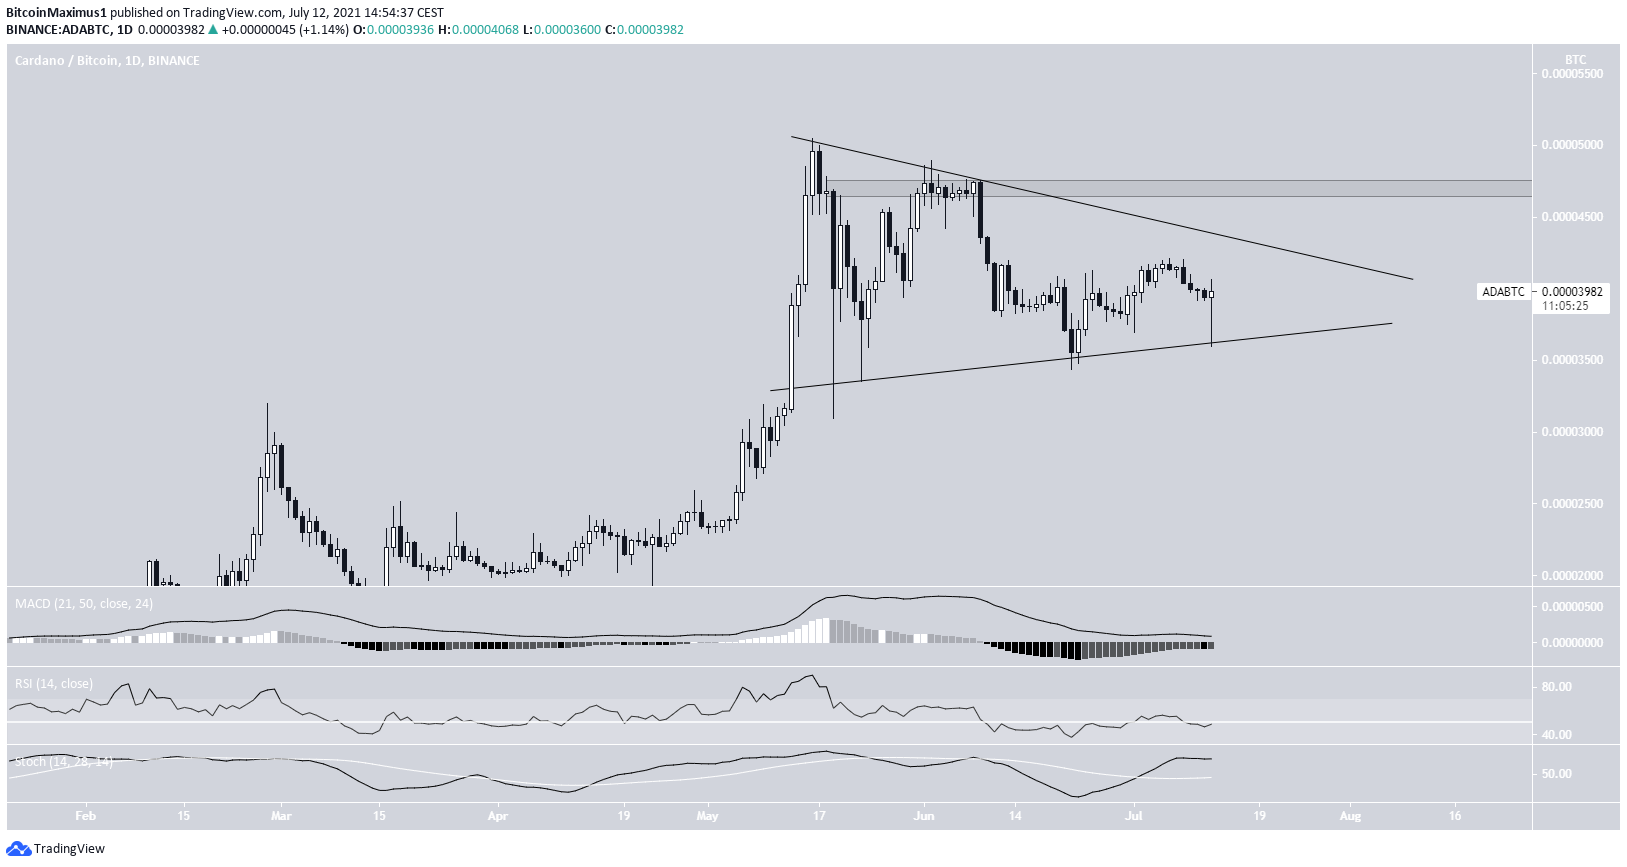
ADA/BTC has been decreasing inside a symmetrical triangle since May 16. It bounced at the support line of the triangle on June 22 and July 13 and is currently in the middle of the pattern.
While the triangle is considered a neutral pattern, it is coming after an upward movement. In addition to this, technical indicators are bullish. Therefore, a breakout would be more likely.
In that case, the closest resistance would be at 4700 satoshis.

Highlights
ADA is following an ascending support line.
ADA/BTC is trading inside a symmetrical triangle.
For BeInCrypto’s latest bitcoin (BTC) analysis, click here.
The post ETH, LTC, ADA – Old Majors Could Outperform BTC appeared first on BeInCrypto.


Be the first to comment