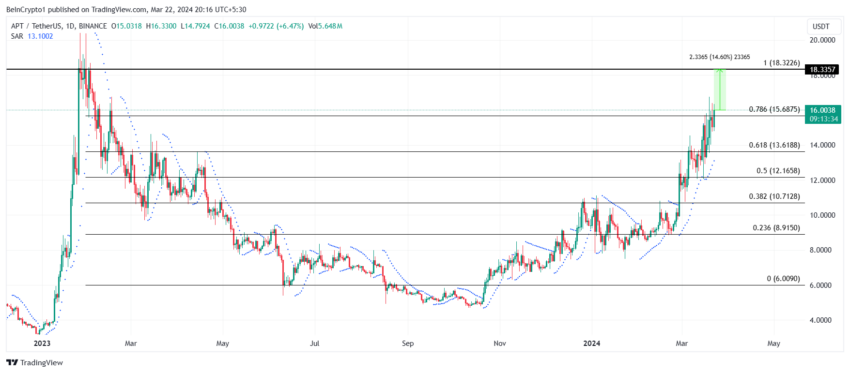
Aptos (APT) price is treading against the broader market cues to consistently post gains on the daily chart.
The altcoin now stands less than 20% away from charting fresh all-time highs, provided APT does not lose this crucial support level.
Aptos Price Finds Support From the Market
Aptos price, trading at $16 at the time of writing, is continuing the bullish trend that began towards the end of February. Despite the prolonged rise in APT by over 80%, the growth remains unstopped and could stay this way.
The first sign of this potential comes from the Average Directional Index (ADX). This indicator measures the strength of a trend to provide a sense of the price’s direction. Values above the 25.0 threshold suggest the active trend is strong and could extend going forward.
This is the case of Aptos price as well, which, in addition to being in an uptrend, is noting strength to its uptrend. Furthermore, investors are likely going to go back to being bullish again as long-term liquidations are now declining.
Read More: An Ultimate Guide to Aptos Cryptocurrency (APT) and Its Network
Long contracts tend to liquidate when the price falls sharply and suddenly, inducing pessimism among investors. This prevents the altcoin from finding support for being bullish again. However, low volumes hint at the bearishness waning, leaving the altcoin open for bullish bets.

Aptos price could benefit from these bullish bets as they would drive the price higher.
APT Price Prediction: Next Stop – All-Time High?
Aptos price is less than 20% away from the all-time high of $19.92. This is the present ceiling reached by APT back in January 2023. Breaching through this barrier would mean that not only has the cryptocurrency formed a new all-time high, but it is also closer to hitting $20.

Read More: How to Buy Aptos (APT) and Everything You Need to Know
However, if Aptos price fails to substantially test the $15.68 line as support it could fall through towards $13.61. Losing this level would invalidate the bullish thesis, pushing APT to $12.16
Disclaimer
In line with the Trust Project guidelines, this price analysis article is for informational purposes only and should not be considered financial or investment advice. BeInCrypto is committed to accurate, unbiased reporting, but market conditions are subject to change without notice. Always conduct your own research and consult with a professional before making any financial decisions. Please note that our Terms and Conditions, Privacy Policy, and Disclaimers have been updated.


Be the first to comment