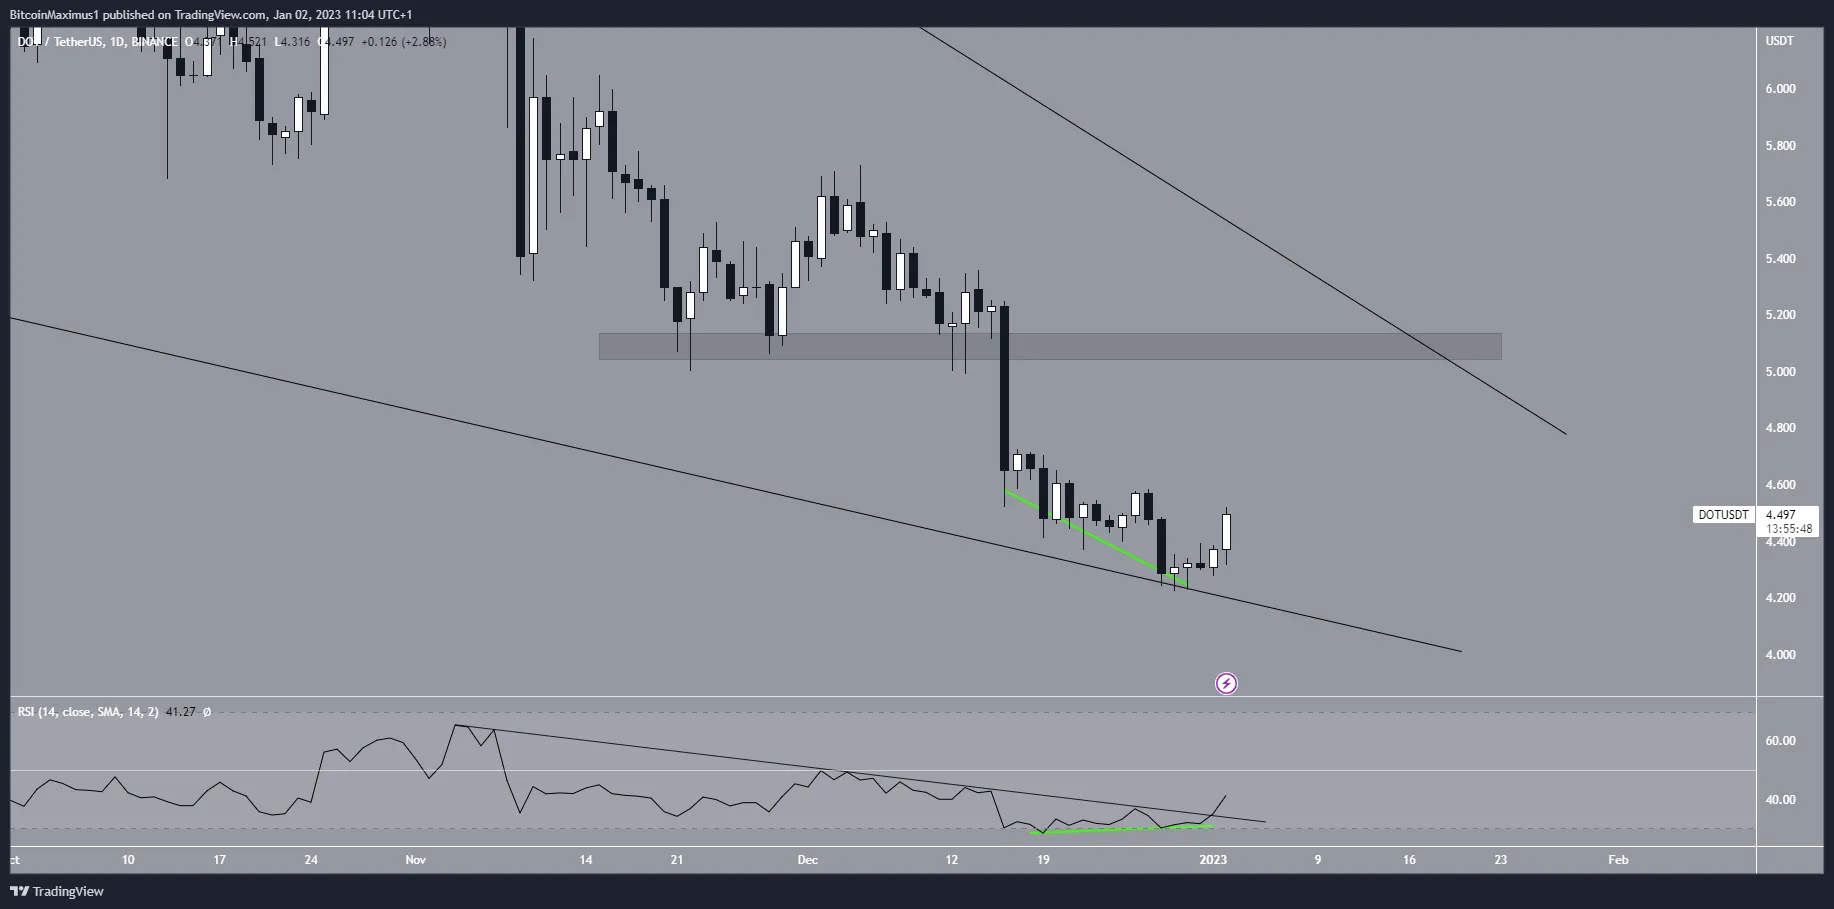
The Polkadot (DOT) price bounced on Dec. 29 and is moving toward a confluence of resistance levels at $5.10. The daily RSI readings supports the bounce.
The Polkadot price has fallen inside a long-term descending wedge since June 13. The decrease led to a minimum price of $4.22 on Dec. 29, before a bounce ensued.
The descending wedge is considered a bullish pattern, meaning that it leads to breakouts most of the time. While the slope of the descending resistance line is not confirmed, the Dec. 29 bounce validated it for the third time (green icon), making it a viable line.
The DOT price increase accelerated over the past 24 hours. If the upward movement continues, the closest resistance would be at $5.10, created by a descending resistance line and the $5.10 horizontal resistance area.
On the other hand, a breakdown from the wedge could lead to the acceleration of the downward movement toward at least $3.60. So, whether the Polkadot price analysis rests on whether the price will break out or down from the wedge.
Polkadot Price Prediction For Jan – Wedge Breakout Incoming?
A closer look at the technical analysis from the daily time frame offers two bullish signals, both relating to the RSI.
Firstly, the daily RSI broke out from a short-term resistance line in place since the beginning of Nov. (black). Such RSI breakouts often precede similar movements in price.
Secondly, the daily RSI generated bullish divergence (green line) before the breakout. The indicator is now moving toward the 50 line, which could also provide resistance. If the rates of increase hold for both the RSI and the DOT price, the price will reach the $5.10 area at the same time the RSI reaches the 50 line.
So, whether the Polkadot price will break out or get rejected afterward could determine the future trend’s direction.

To conclude, the most likely short-term Polkadot price forecast is an increase toward the $5.10 area. The movement once the DOT coin price gets there is still unclear. If the price gets there but fails to break out, it could still consolidate inside the wedge until an eventual breakout. Therefore, the possibility of a bullish reversal remains intact as long as the DOT price does not break down from the wedge.
For BeInCrypto’s latest crypto market analysis, click here.
Disclaimer
BeInCrypto strives to provide accurate and up-to-date information, but it will not be responsible for any missing facts or inaccurate information. You comply and understand that you should use any of this information at your own risk. Cryptocurrencies are highly volatile financial assets, so research and make your own financial decisions.


Be the first to comment