Bitcoin Price Prediction – October 4
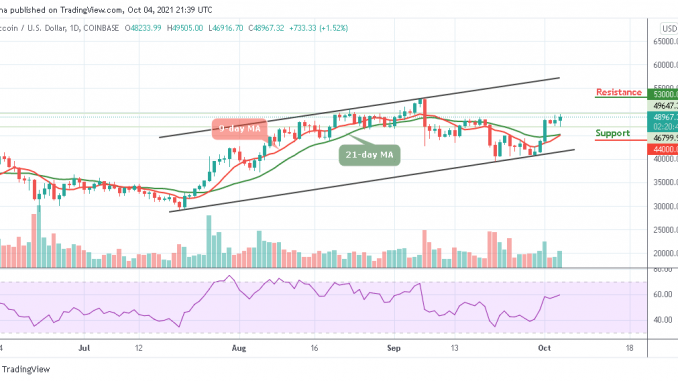
The Bitcoin price touches the daily high of $49,505, the coin is holding above $48,500 level and it may likely retest $48,000 before rising again.
BTC/USD Long-term Trend: Ranging (Daily Chart)
Key levels:
Resistance Levels: $53,000, $55,000, $57,000
Support Levels: $44,000, $42, 000, $40,000
BTC/USD has been extremely volatile as the coin touches the daily high of $49,505 and after touching the daily low of $46,916. At the moment, the Bitcoin price seems to be stuck around $48,700 range for more than few hours ago. More so, BTC/USD is in an ascending channel forming higher highs and higher lows. Therefore, since the price is above the 9-day and 21-day moving averages, it indicates that a breakout may likely come to play.
Bitcoin Price Prediction: Bitcoin (BTC) May Rise Beyond $50,000
According to the daily chart, if the Bitcoin price keeps hovering above the moving averages, traders can expect a rise the upper boundary of the channel. However, it is important to note that the red-line of 9-day MA is about to cross above the green-line of the 21-day MA which could easily confirm the arrival of the bullish trend.
On other hand, if the market price drives below the moving averages, the BTC price may likely see support levels at $44,000, $42,000, and $40,000, bringing the price to a new low. Meanwhile, a strong buying pressure may take the price to the resistance level of $50,000. While trading at that level, a bullish continuation could hit the potential resistance levels of $53,000, $55,000, and $57,000 as the Relative Strength Index (14) is likely to cross above 60-level.

BTC/USD Medium – Term Trend: Ranging (4H Chart)
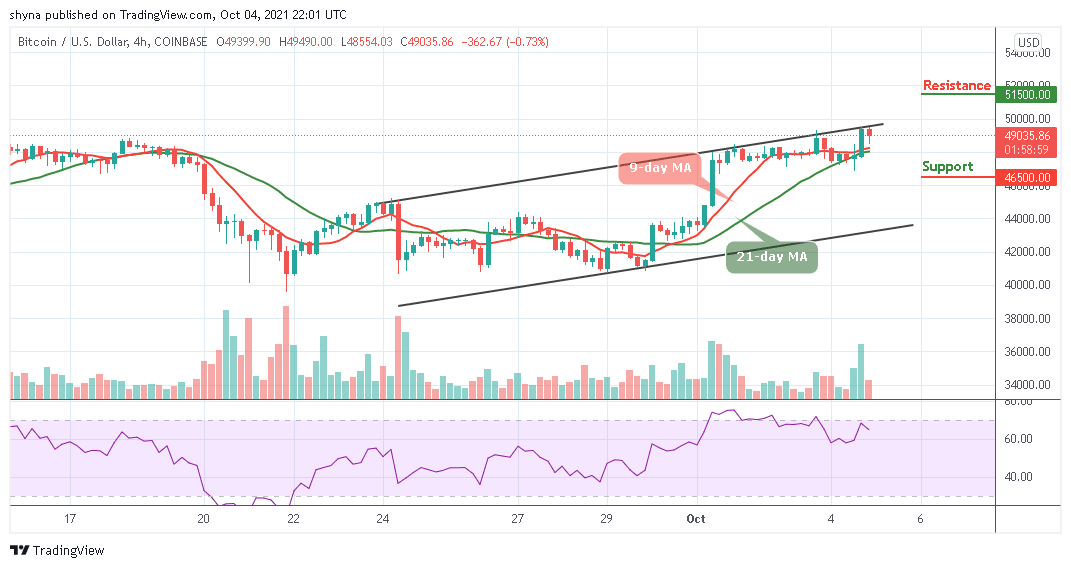
Looking at the 4-hour chart, BTC/USD remains trading above the 9-day and 21-day moving averages. Nevertheless, Bitcoin has not yet slipped below this barrier as it is still in the loop of making a bounce back. Therefore, BTC price hovers around $49,035 and may take time to persistently trade above the upper boundary of the channel. The upward movement could face the resistance levels of $51,500 and above.

However, on the downside, immediate support is below the moving averages while the main support is at the $48000 level. The price might slide sharply below $47,500 which may likely test the main support at $46,500 level. More so, BTC/USD is likely to face more losses in the near-term as the Relative Strength Index (14) nosedives below 70-level, indicating a reversal for the bearish movement.
Looking to buy or trade Bitcoin (BTC) now? Invest at eToro!
67% of retail investor accounts lose money when trading CFDs with this provider
Read more:


Be the first to comment